This tutorial will help you animate your PowerPoint line graph, bar chart or column chart – showing its values animate over time.
What Are We Going to Do
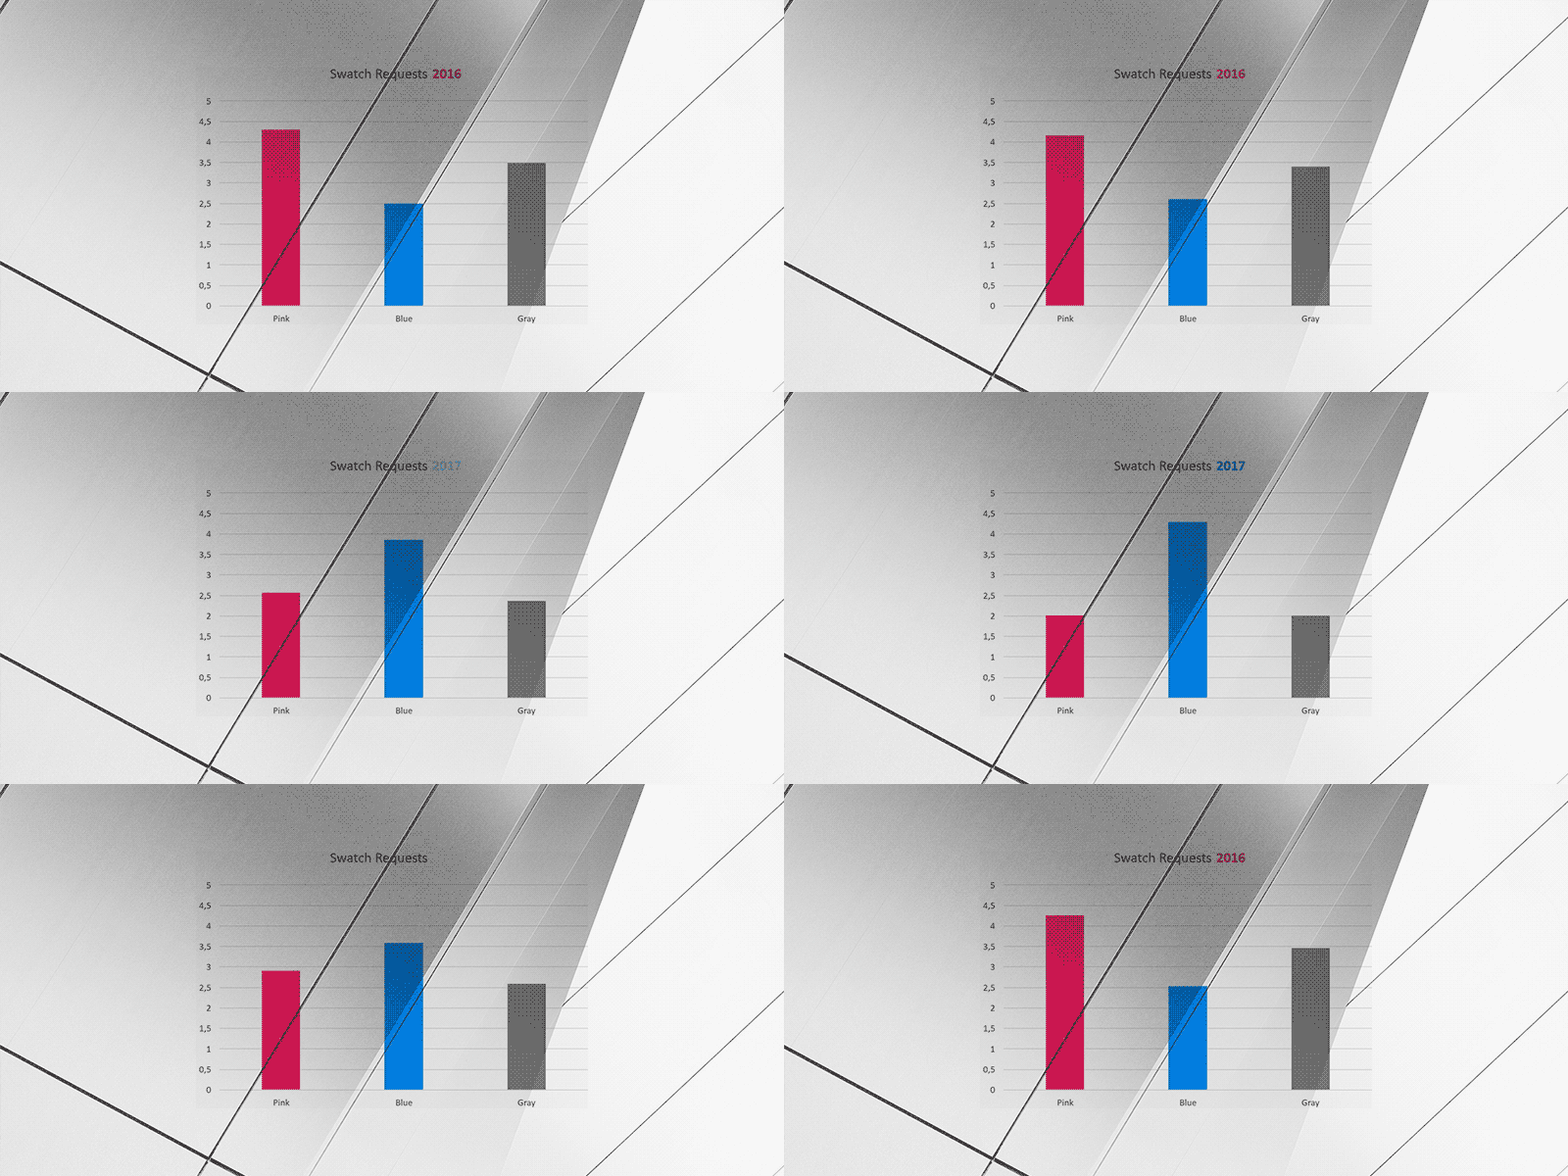
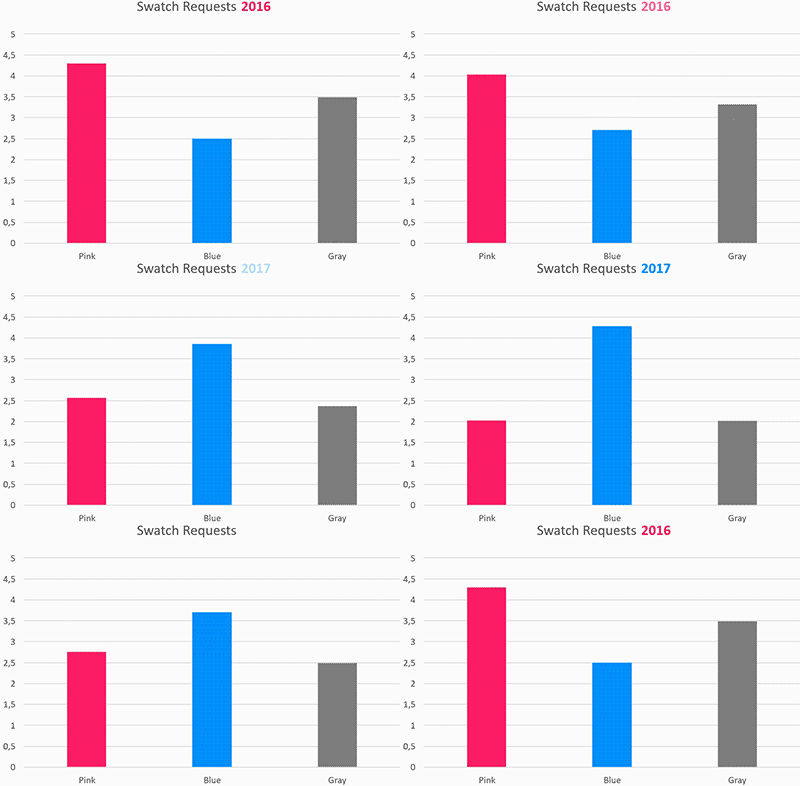
In this tutorial, we are going to create two slides – one slide with the “before” view and one with the “after” view. Then we create a PowerPoint morph transition between the two slides – which will create your graph animation. You can do this for many things, not just graphs so this is a valuable skill to learn for other types of animations as well.
If you aren’t sure what a morph animation is then maybe this music video will help jog your memory:

Step 1:
Prepare your BEFORE and AFTER charts to have exactly the same size and position.
REASON: Everything that moves between the slides will animate. You don’t want to draw attention to other parts of the slide, only to the changing graph.
Step 2 (Not applicable for line graphs):
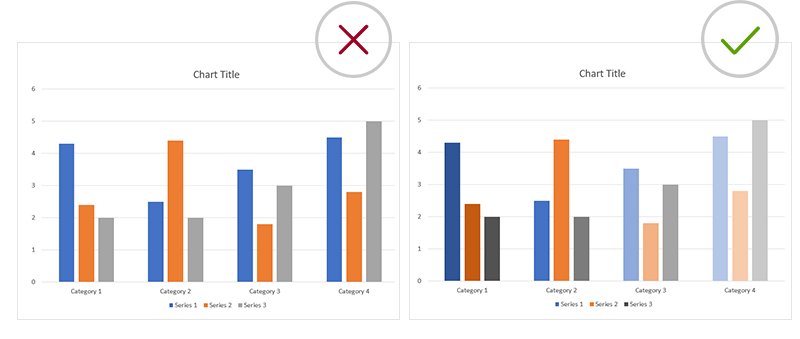
Make sure every bar uses a distinct color.
REASON: You need to force PowerPoint to create unique shapes when you convert your charts to animate-able graphics. To do this, every bar needs to be a unique color otherwise it will group them together and the animation won’t work. If you need all your bars to be the same color you can change their fill color after you finished the animation.
Step 3:
Create two new blank slides for your animated BEFORE and AFTER slides. Hide your original (editable) charts for future editing OR if you need to start over.
Step 4:
On your ORIGINAL Before slide; copy your graph by using Ctrl C OR selecting Copy from the Home Ribbon
Step 5:
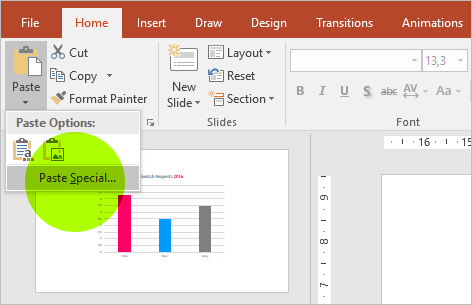
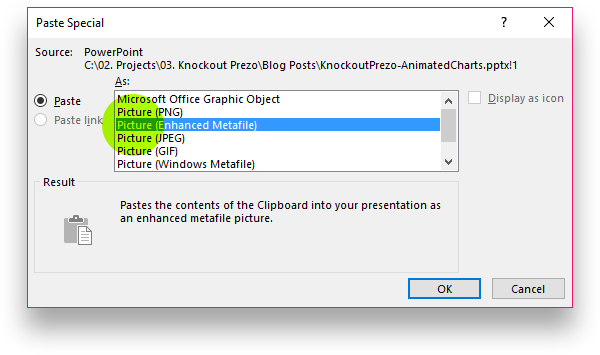
On your NEW Before screen click on the Paste drop-down arrow and select Paste Special
Step 6:
You will be presented with a list of formats in which you can paste content. Select Picture (Enhanced Meta File), which is a vector based asset.
Step 7:
Resize and center your chart again.
REASON: PowerPoint does not ‘paste’ the new vector based chart to its original dimensions. So you have to resize and align the graph again.
Step 8:
Repeat steps 4,5,6 and 7 for your AFTER chart
Step 9:
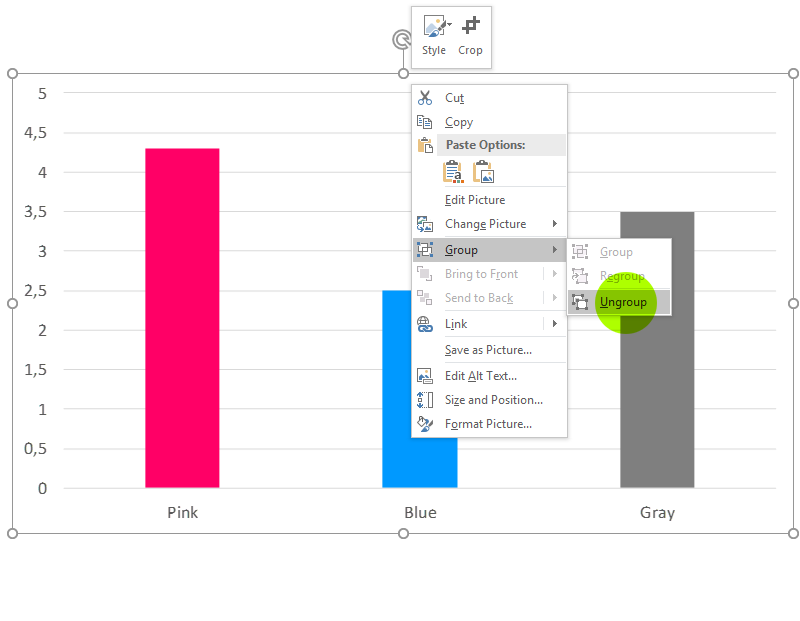
Clean up. We need to do a bit of clean-up for our animations to work. Ungroup your new assets. Right click on your new graphics and select Ungroup.
PowerPoint will give you a warning saying you are about to convert this new image as a drawing object, go ahead and select Yes.
Step 10:
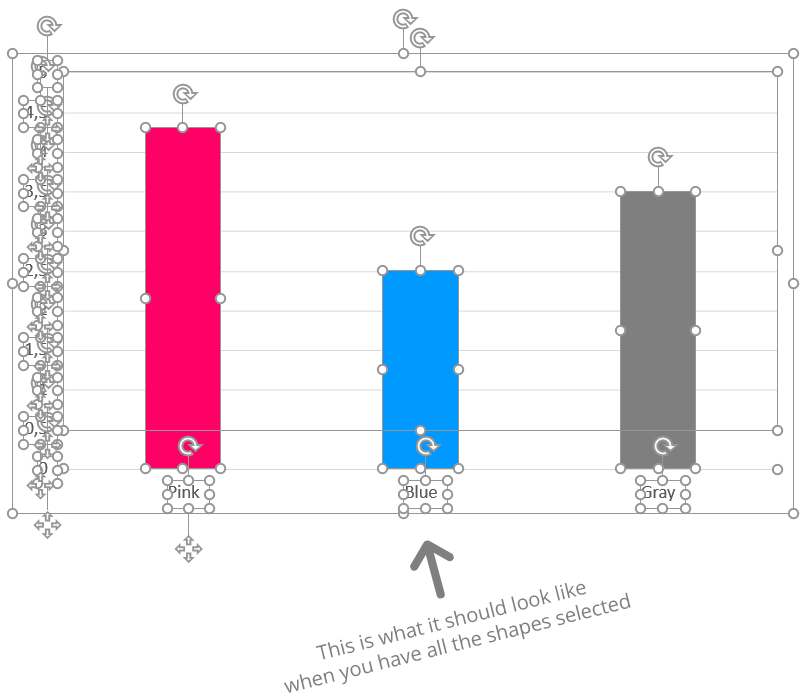
Ungroup again. Now that you have a vector based graphic you need to ungroup it again so that all the elements are editable individual objects.
REMEMBER to ungroup twice for your After graphic as well.
Note: Powerpoint creates an invisible object on top of all of these newly created vector objects. You can delete it or ignore it.

Step 11:
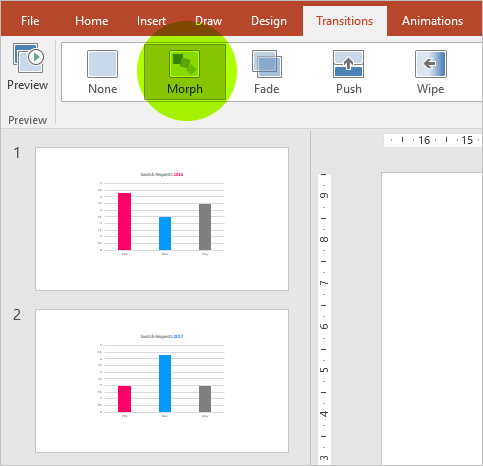
Select the Morph transition between your two new slides and voila, you are done!
Step 12 (Optional):
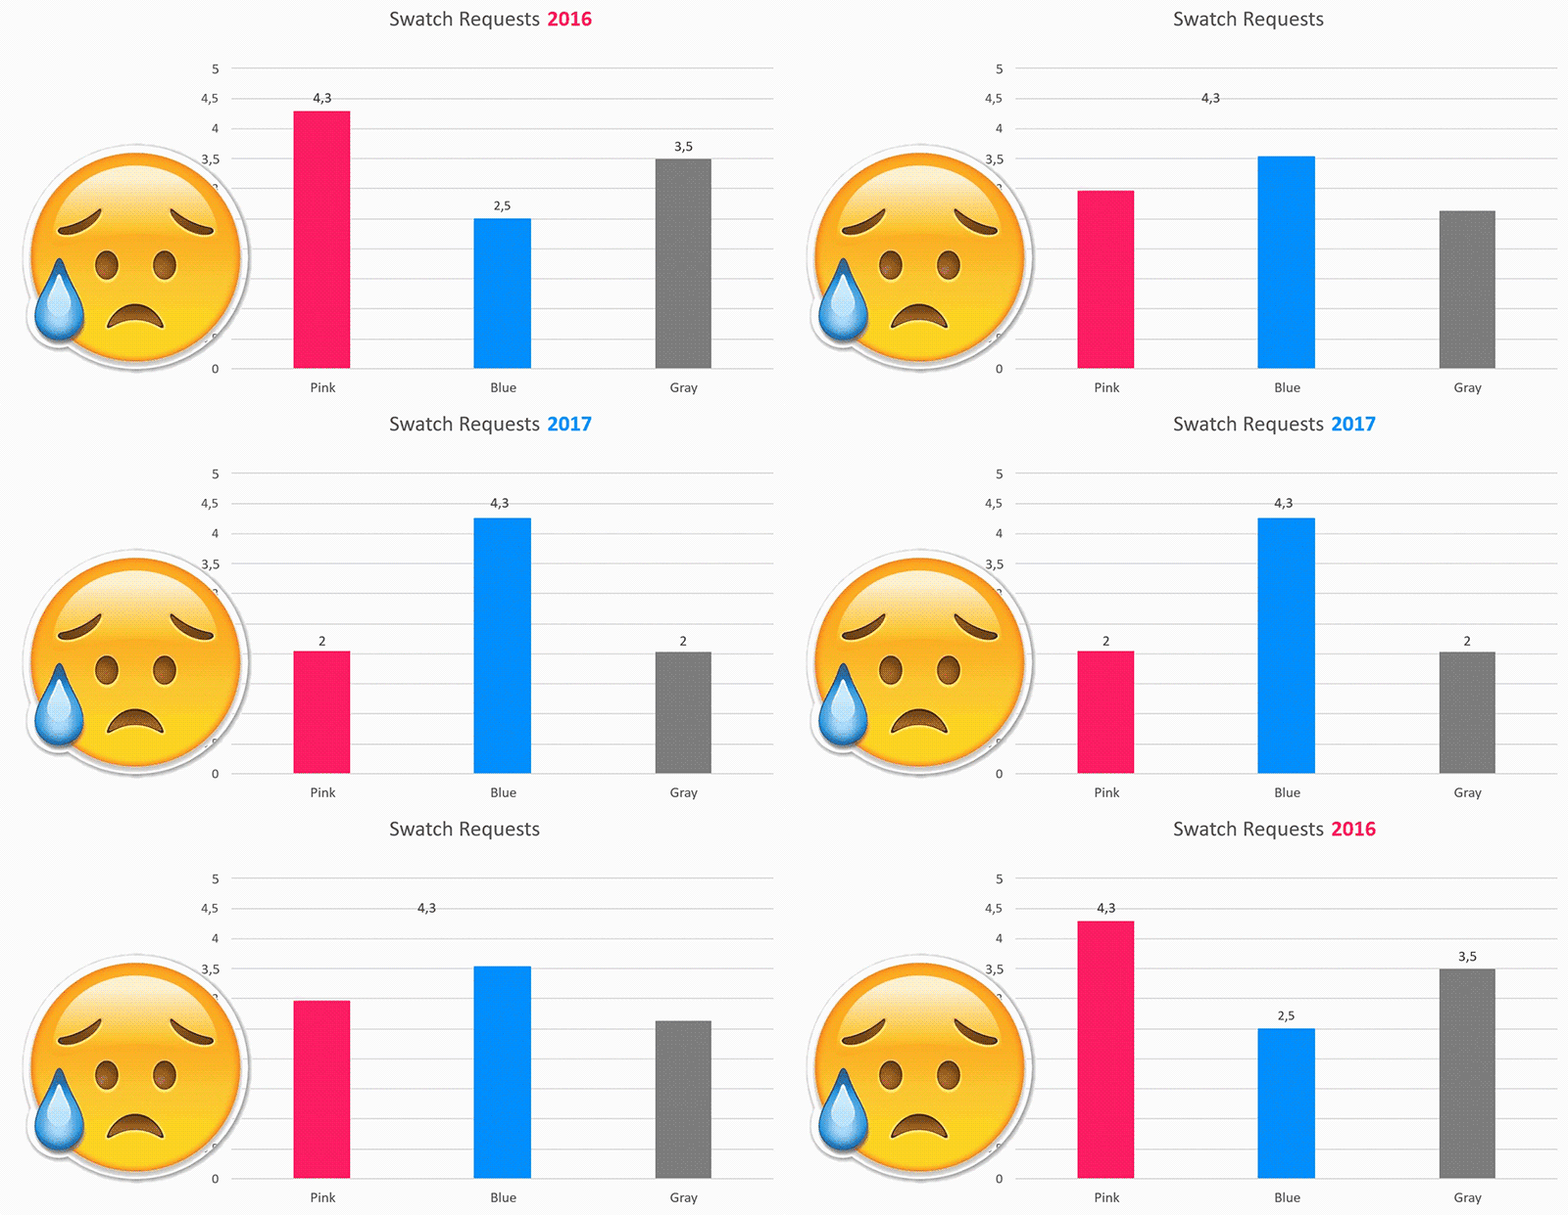
If you are using labels when you animate graphs in PowerPoint to change over time you will notice they move around across the screen, which is not ideal.
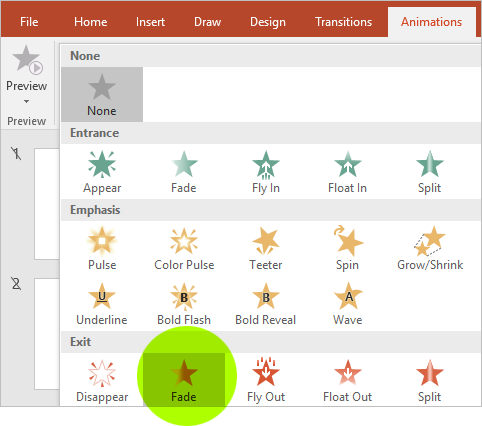
To fix this, you need to fade your labels out before the transition begins; use the “Fade out” animation.
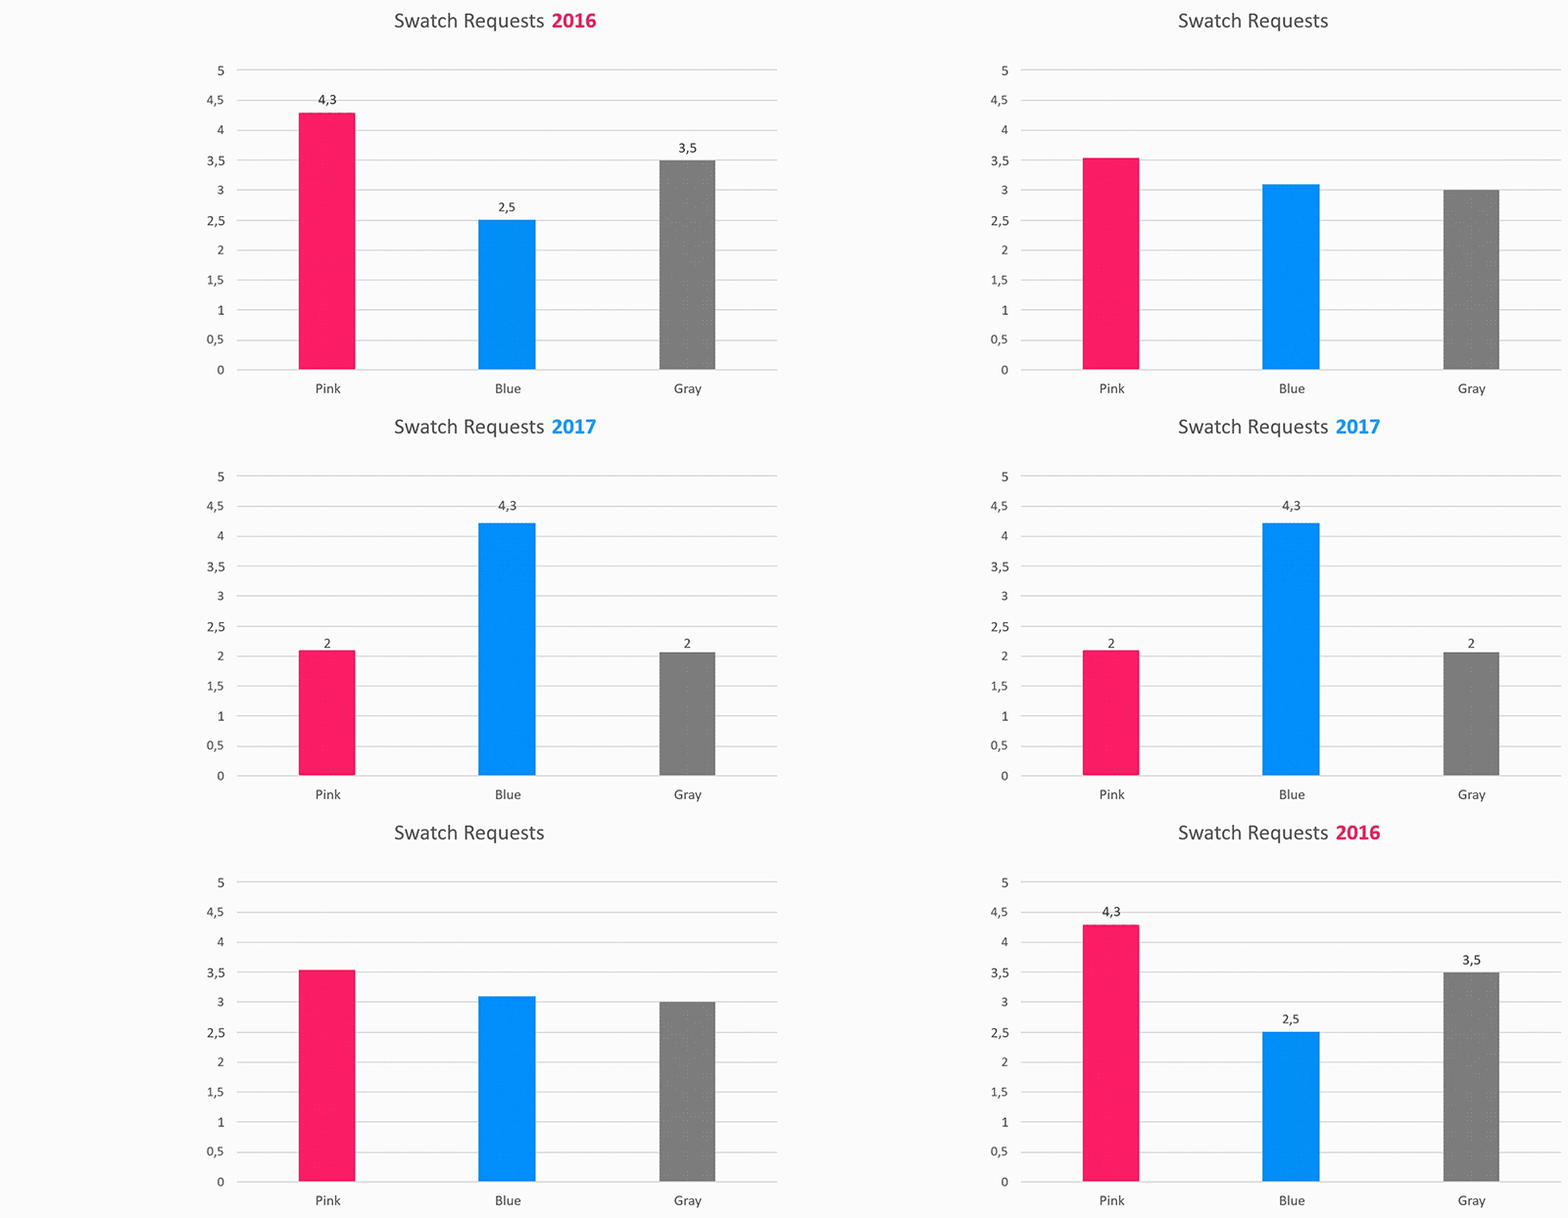
Now you should have something like this example where the labels fade out before the chart animates.
Here is the PowerPoint file if you want to tinker with it.
What you need to keep in mind when you animate your graphs in PowerPoint to change over time
- You should do this right at the end and keep a backup of your original graphs because you are going to break them into animatable graphics and they will no longer be editable in the traditional sense.
- You need a PowerPoint version that has the morph transition, which should be all the modern versions of PowerPoint to play the animation.
- Although the animations work on the Mac version of PowerPoint, you cannot create the animation on the Mac version (it does not have the option to paste the graphic as a vector EMF asset). You will need to create the animation on a PC but you can open and edit the document once you get it back on your Mac without any issues.
Do you have questions or suggestions about how to animate graphs in PowerPoint to change over time, let us know on Twitter @knockoutprezo
One more thing,.. when go back to the previous slide in presentation mode, the animation plays backward.
Does this seem like too much trouble to go through? Do you want us to help you animate your charts for you instead? Email us at [email protected]
[contextly_auto_sidebar]





2 Responses
Thank you for this post, it was very useful!
I’m having some problems with mine though. I’m trying to animate a line graph that has dots and error bars, and everything moves around during the transition. any suggestions?
Is there any way you could send me a sample or a video of what it does?